


Website last updated: 05.05.2026
New (since 29.01.2026): Calculating the ranking using Excel (tutorial and example file)
▸Download
Further links:
▸Current tournament progress on your website
▸Tournament schedule for the Swiss System
▸Tournament schedules for volleyball and badminton
▸ League plan for volleyball and badminton
Crucial help for tournament plan hobbyists ▸see below
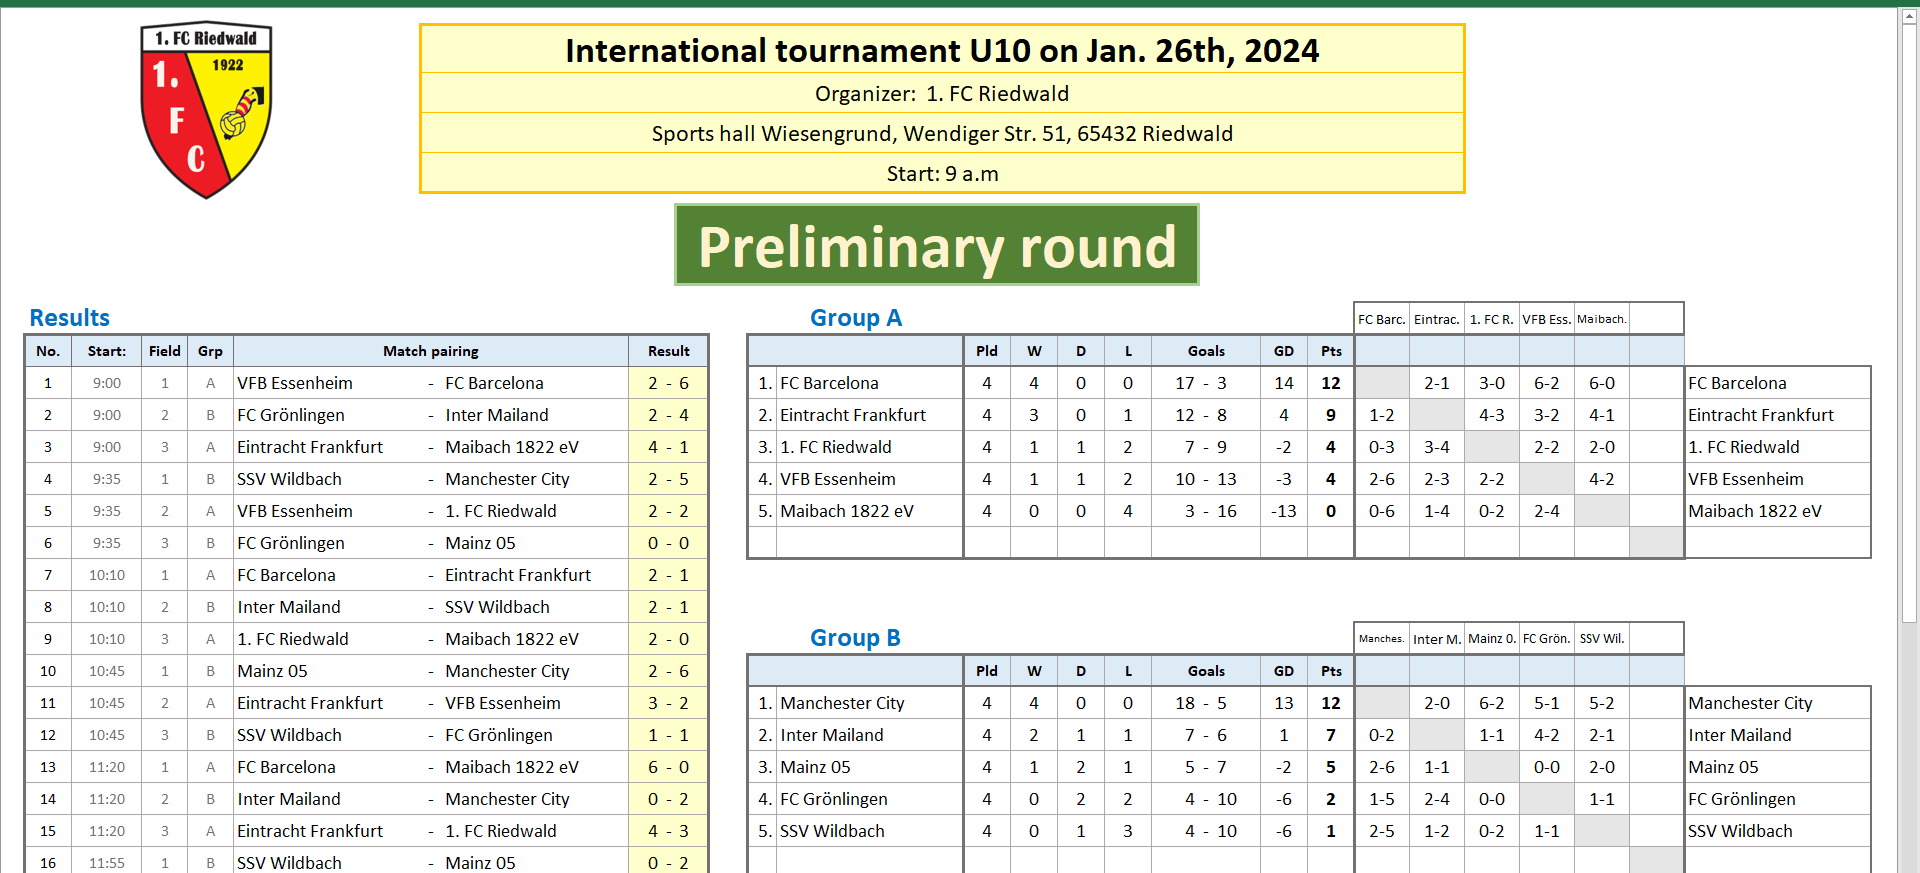
The tournament schedules are suitable for the sports of football, handball and other comparable sports. The overall tables are automatically calculated according to the criteria of points, goal difference, goals scored and, if necessary, direct comparisons.
Free download - no advertising - everything open and changeable - no usage restrictions
• A version with a maximum of 16 participants or with a maximum of 24 participants is also available on request.
These are six Excel files (.xlsx) that do not use any programming with Microsoft's own programming language VBA (that means no macros), so that they can also be used with free spreadsheet programs (tested with LibreOffice 7.4.2.3) or on company computers where macros are deactivated for security reasons.
* * *
| Number of groups |
Teams per group |
Number of fields |
Options for final rounds |
|
|---|---|---|---|---|
| 1. schedule | 1 | 3 - 9 | 1 - 4 | - - - |
| 2. schedule | 1 | 3 - 12 | 1 - 6 | - - - |
| 3. schedule | 2 | 3 - 6 | 1 - 6 | 4 |
| 4. schedule | 2 | 3 - 9 | 1 - 6 | 5 |
| 5. schedule | 3 | 3 - 6 | 1 - 6 | 4 |
| 6. schedule | 4 | 3 - 6 | 1 - 6 | 7 |
The special feature of these tournament schedules (in addition to the high quality of the user interface) is their diversity and flexibility. You can find a lot of tournament schedules on the internet. Almost all of them offer a specific option such as "Tournament schedule for 4 groups of 4 teams with semi-finals and finals on 2 fields". If there are to be 3 playing fields or 5 teams per group, you have to keep looking for a suitable match plan.
The six tournament schedules available here cover most of the common options. For example, if we take the third tournament schedule (for 2 groups), it alone already offers a lot of options: if you only count the options in which the number of teams in both groups is the same and only take into account the options in which there are no time conflicts for the number of playing fields, you come to 64 different ways to hold a tournament.
* * *
All six tournament schedules are highly automated. Each time you enter a new team, the fixtures, the distribution of the individual matches across the playing fields and the calculation of the kick-off times are immediately adjusted. Every time a match result is entered, the final tables are updated immediately.
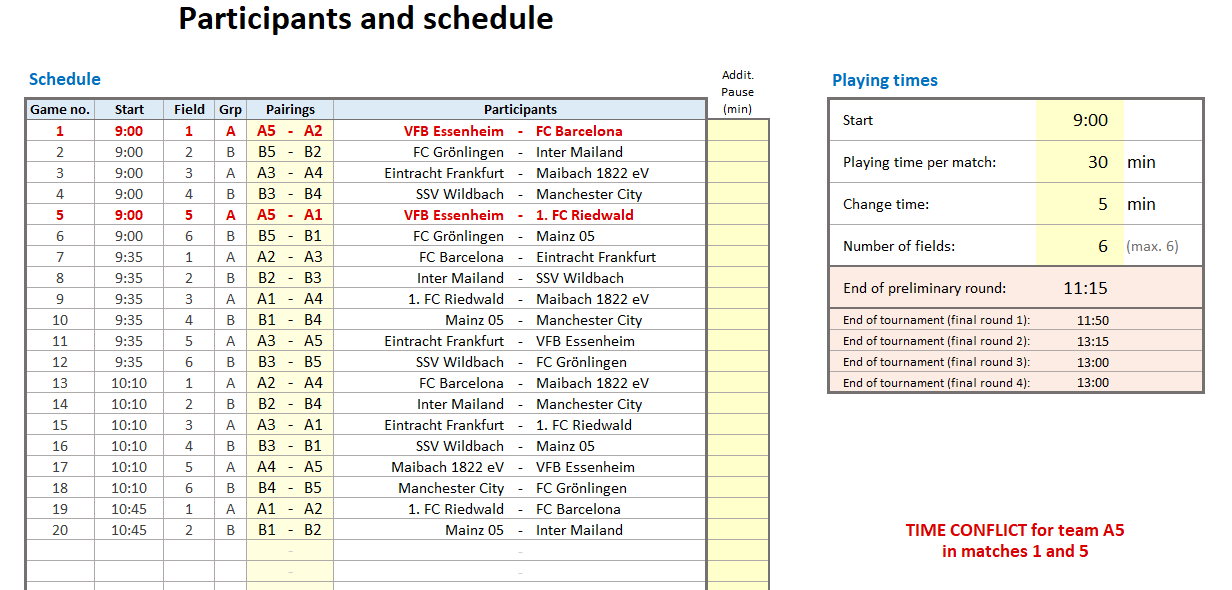
If you change the number of playing fields, you can immediately see the new distribution of the individual matches across the playing fields and the new kick-off times. If you choose too many playing fields, time overlaps can occur because a certain team cannot play on two playing fields at the same time. In this case, a warning appears and you are shown the team in question and the numbers of the affected matches - not all of them, but the first critical case found. The two affected matches appear in red font.
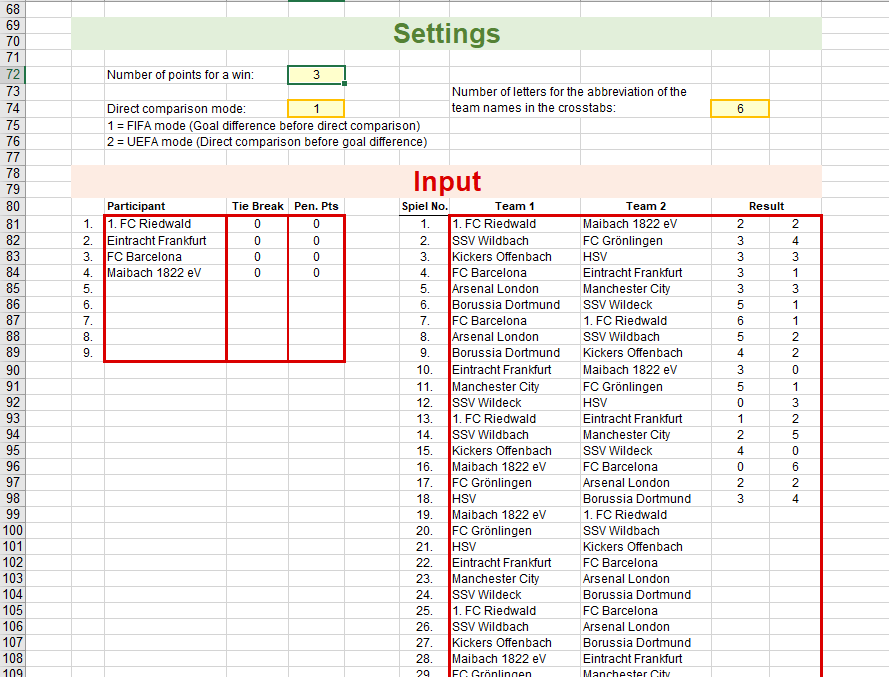
In the settings you can decide whether 2 or 3 points are credited for a win. You can also choose whether the direct comparison is evaluated before the goal difference (UEFA mode) or whether the direct comparison is only carried out if there is a tie in points, goal difference and goals scored (FIFA mode). In this respect, these tournament schedules are not only suitable for football, but also for handball and other sports.
Especially in UEFA mode, it can be interesting and informative to show the hidden worksheets with the tables of direct comparisons (worksheets 'DirComparison_A', 'DirComparison_B', etc.) in order to see why a team with the better goal difference is still in a worse place in the table.
The tournament schedules are so flexible that the number of teams per group can also be different. So if a team cancels at short notice, you can definitely play with two groups of five and one group of four. Theoretically, for example, it wouldn't be a problem to play with a group of six, a group of five and a group of three.
In the event of time delays during the tournament (e.g. due to a necessary penalty shootout or additional breaks), the additional time can be entered in the tournament schedules after each match. The kick-off times of all subsequent matches will then be adjusted accordingly.
The six tournament schedules are described in more detail below.
* * *
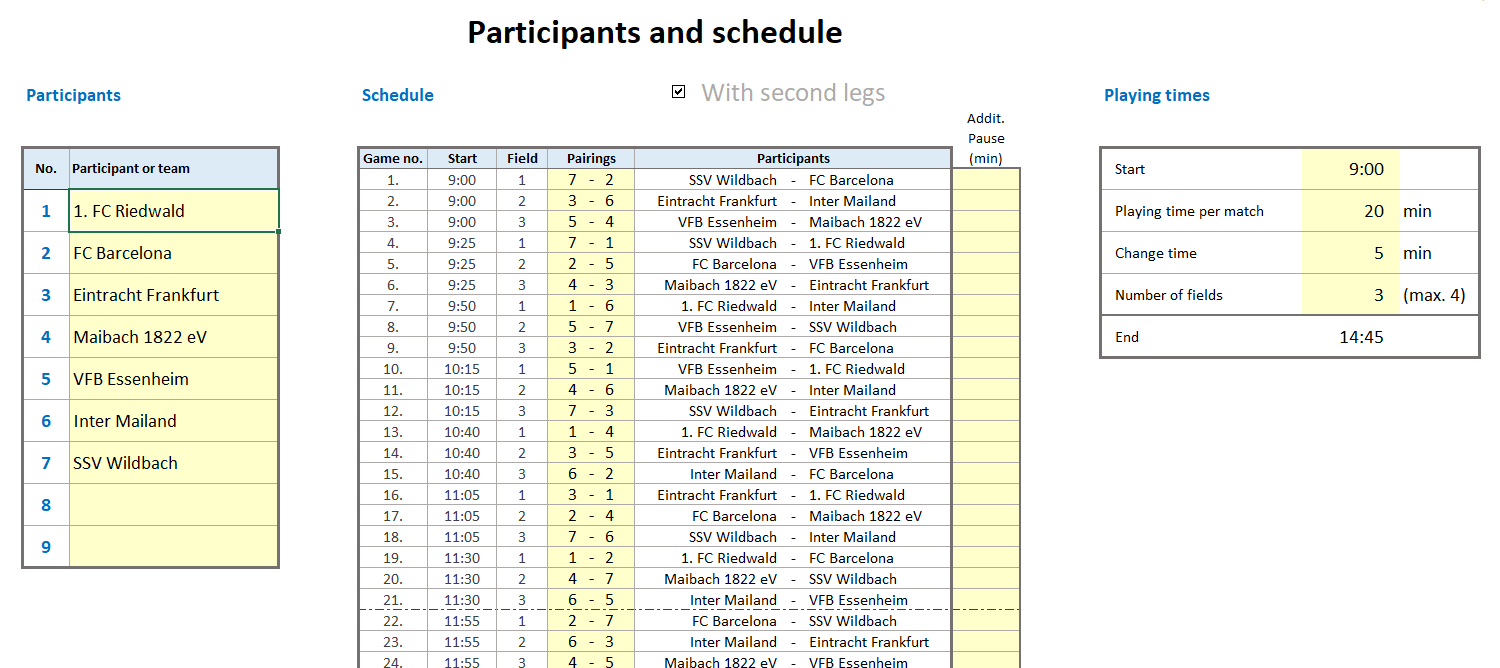
The names of the teams are first entered on the “Planning” spreadsheet shown here. If at least 3 teams have been entered, the corresponding fixtures will appear automatically - either with or without second legs.
If you would prefer to enter your own fixtures instead of the automatically generated fixtures, you can delete the formulas in the two corresponding columns and enter your own fixtures manually. For detailed instructions on deleting these (array) formulas, see the “Info” worksheet.
Alternatively, you can also generate matchups with a random number generator. There is an Excel file programmed in VBA for this - see
▶ tournament schedule for the Premier League - Create matchups.
In the final table, teams whose ranking is not clear are shown in red. In the event of a draw or a fair play rating, it is possible to clarify the ranking by entering a 'bonus point' for the preferred team.
Handball players have the option of setting the number of points for a win to 2 points on the “Settings” sheet. You can also choose here whether the direct comparison has priority over goal difference and goals scored or not.
An individual tournament schedule can be printed out for each participating team, which includes the kick-off times and playing fields for that team.
* * *
Since I repeatedly received requests for a match plan for 12 participants, I have expanded the match plan with a maximum of 9 participants to a maximum of 12 participants. Otherwise, there is no difference to the match plan for a maximum of 9 participants.
Actually, this would be superfluous now. However, it still has a right to exist because, for example, if there are only 7 participants, you don't have quite as many empty fields on the screen.
* * *
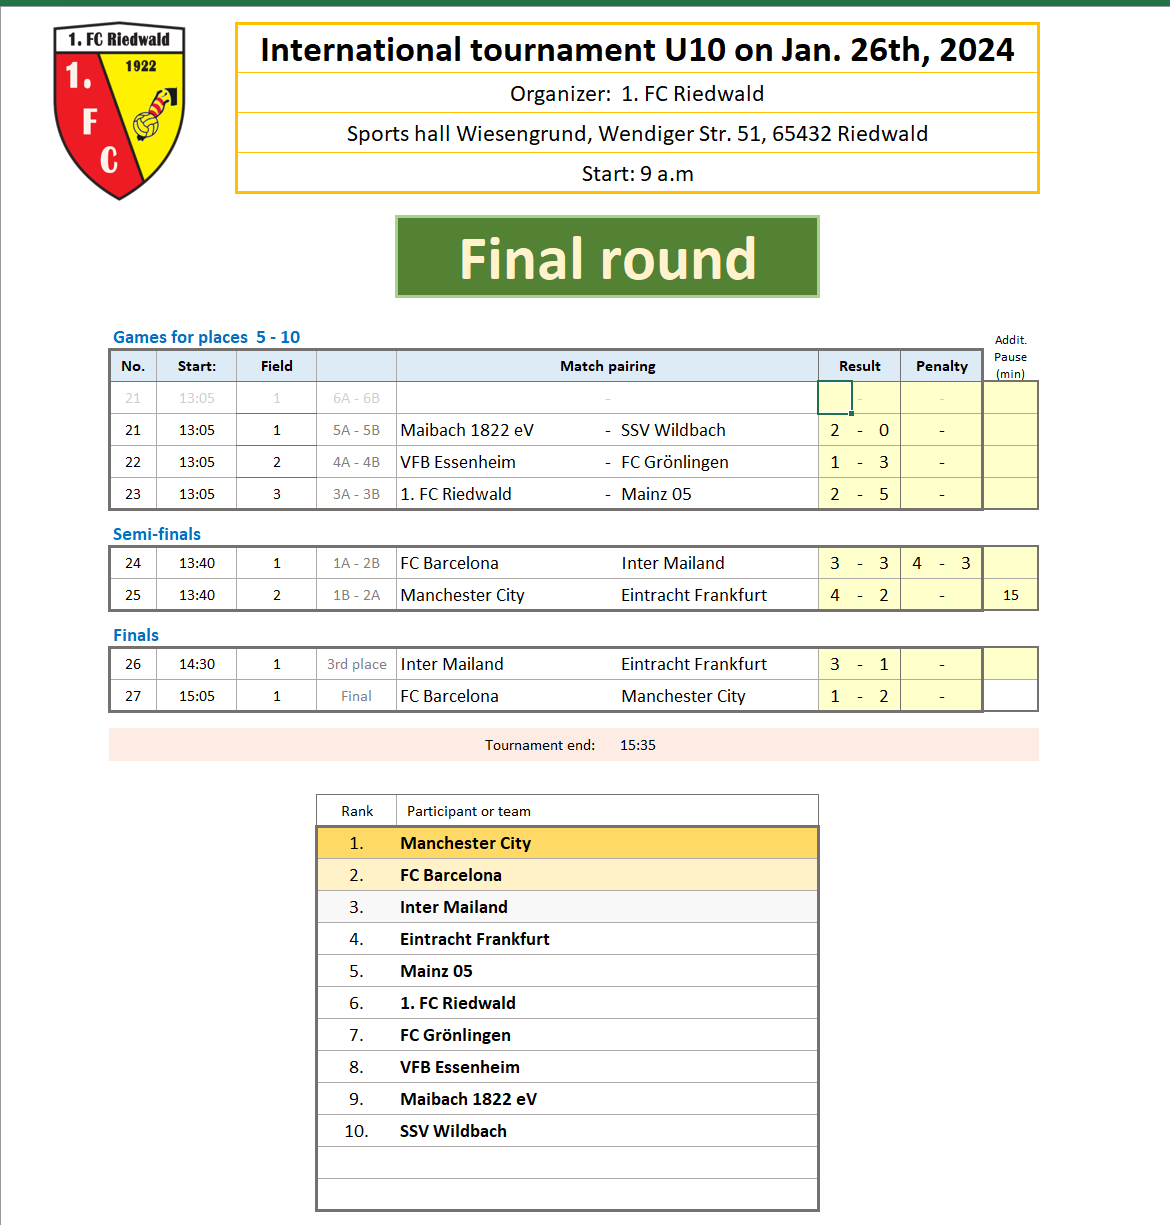
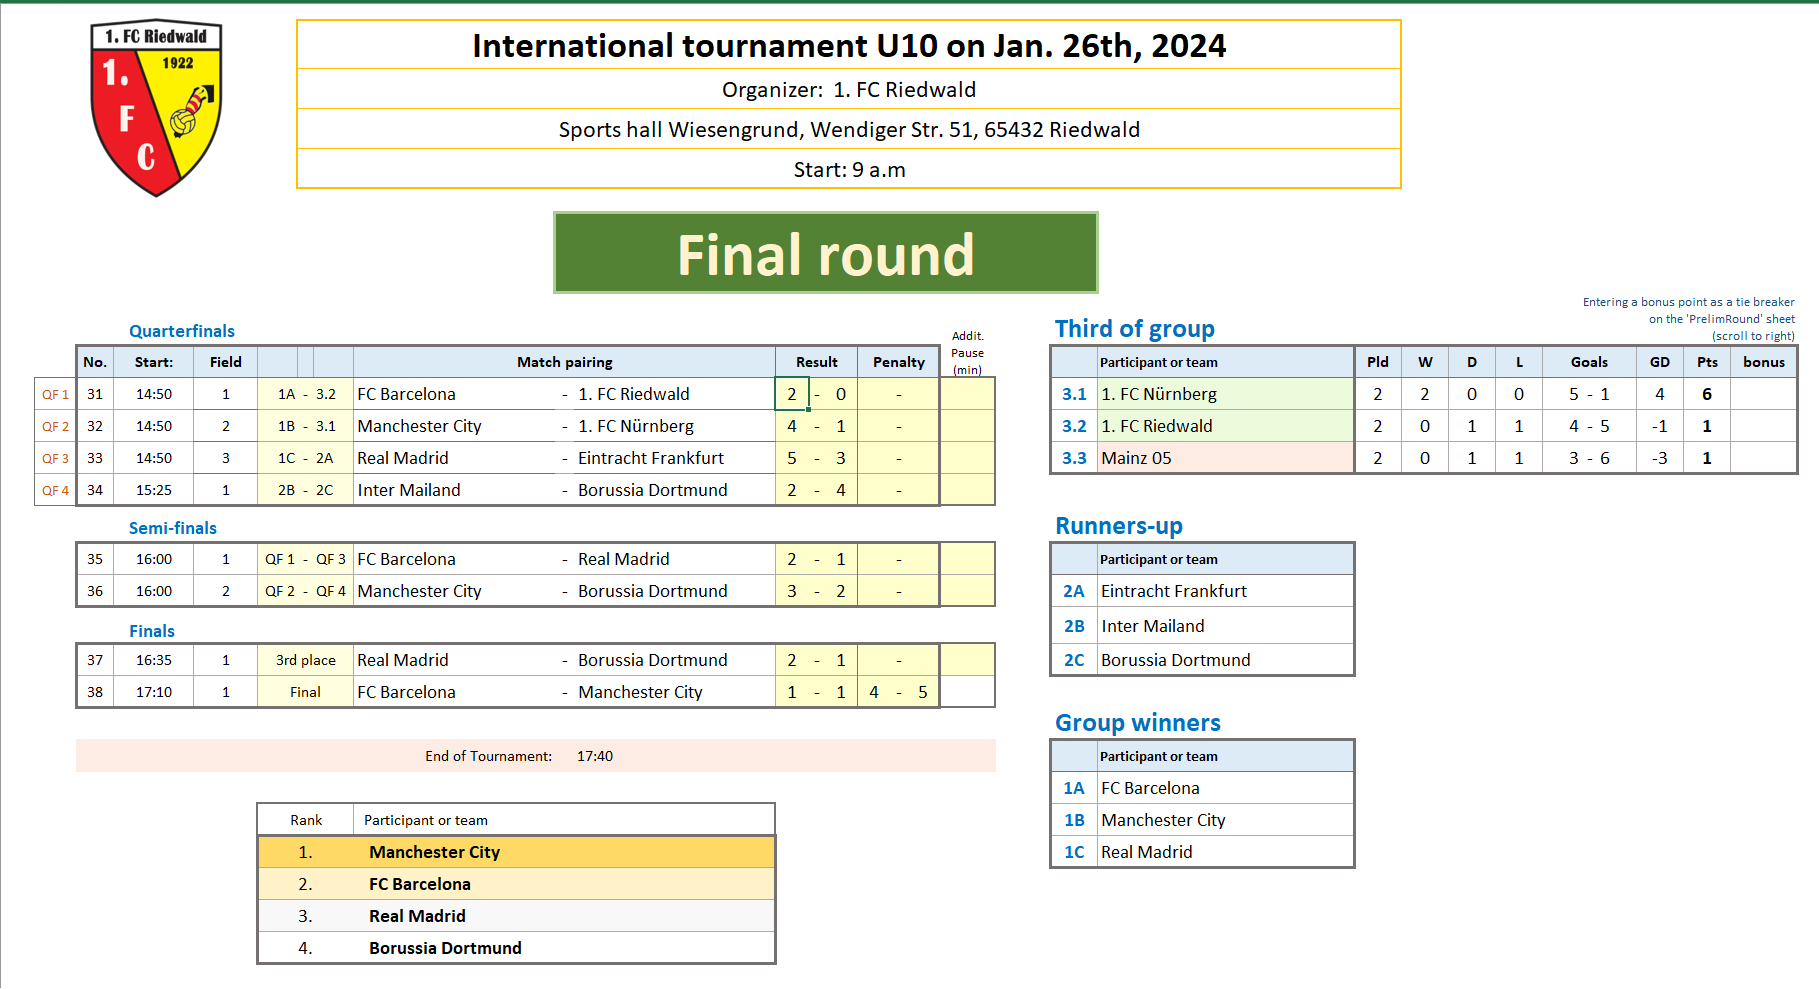
The schedule for two groups consists of a preliminary round (group phase) and a final round. There are four options to choose from for the final round:
The following figure shows the second option for the final round in the case of 2 x 5 teams:
* * *
This schedule is a subsequent extension of the schedule with a maximum of 6 participants per group to a maximum of 9 participants per group. In addition, he has the following additional option for the final round:
The two group winners and the two group runners-up contest a semifinal, a third-place match, and a final. They will occupy positions 1 to 4 in the final standings. Positions 5 to 8 will be decided in the same way, with a semifinal, a seventh-place match, and a fifth-place match. Positions 9 and below are played out in a single knockout match, as in the first option.
* * *
After the group phase, there are four options for the final round:
The following figure shows the second option of the final round in the case of 3 x 5 teams:
* * *
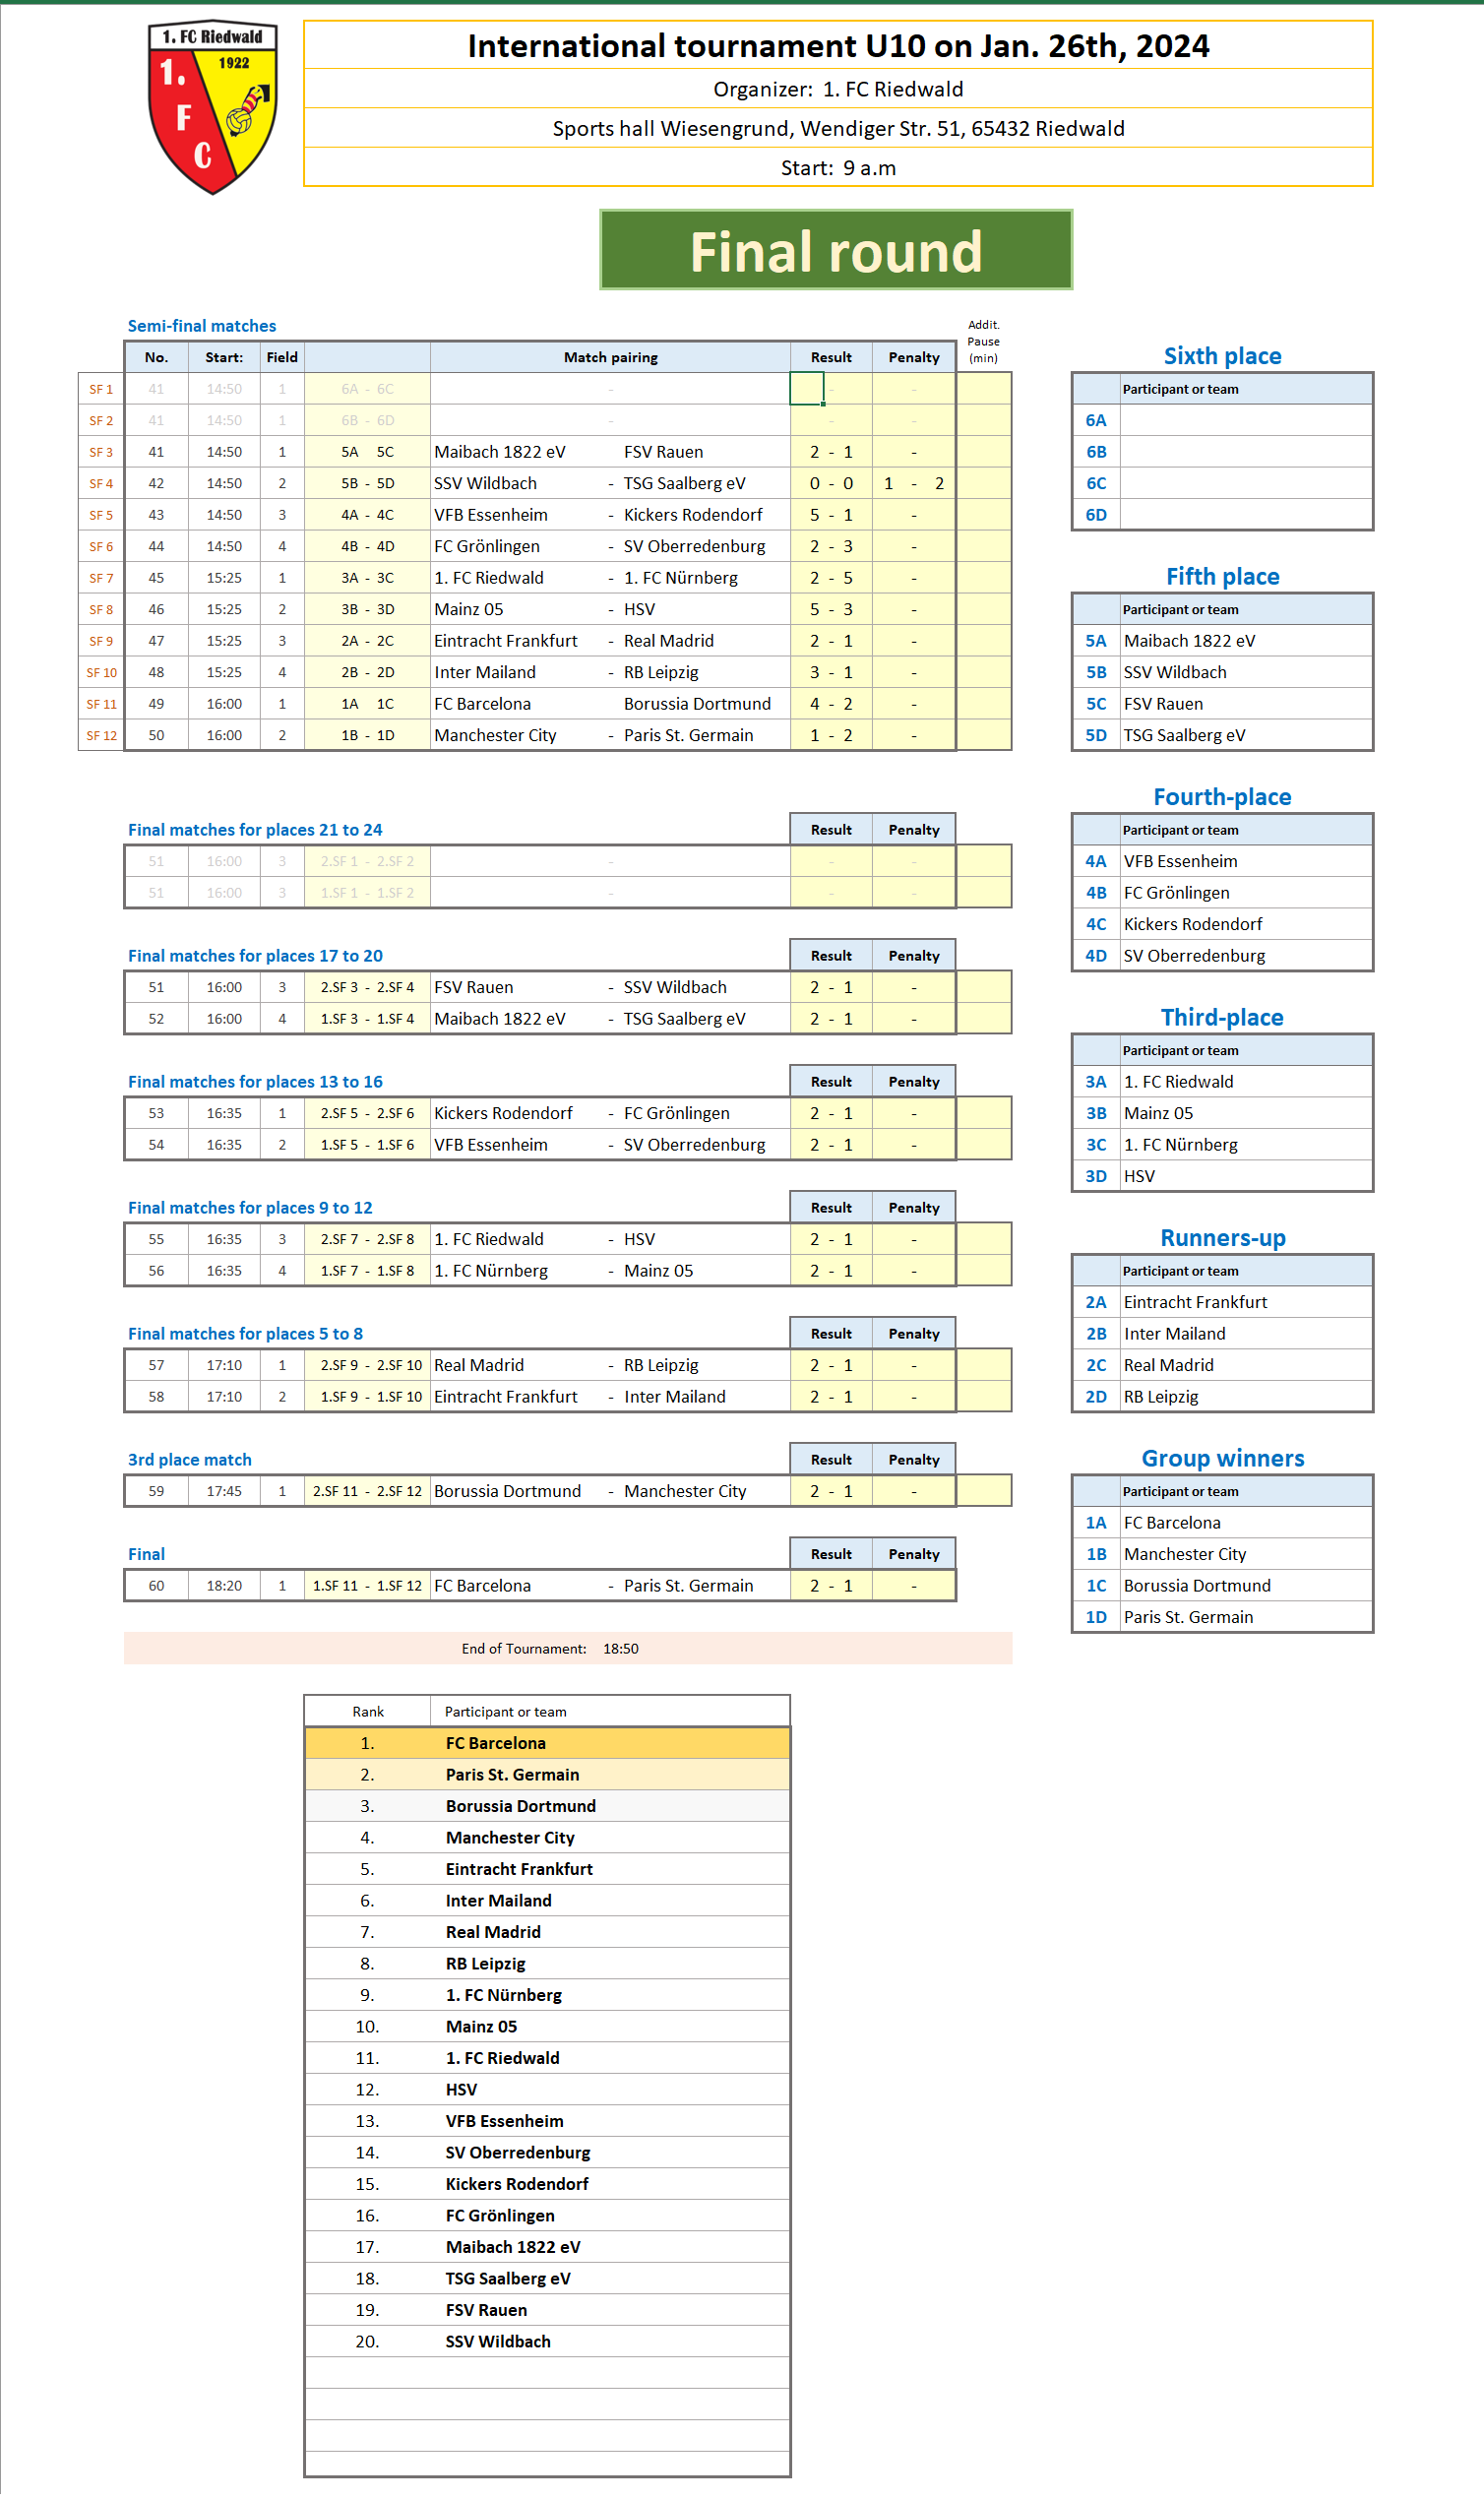
The group stage is followed by a final round, for which there are seven options:
The following figure shows the first option of the final round in the case of 4 x 5 teams:
* * *
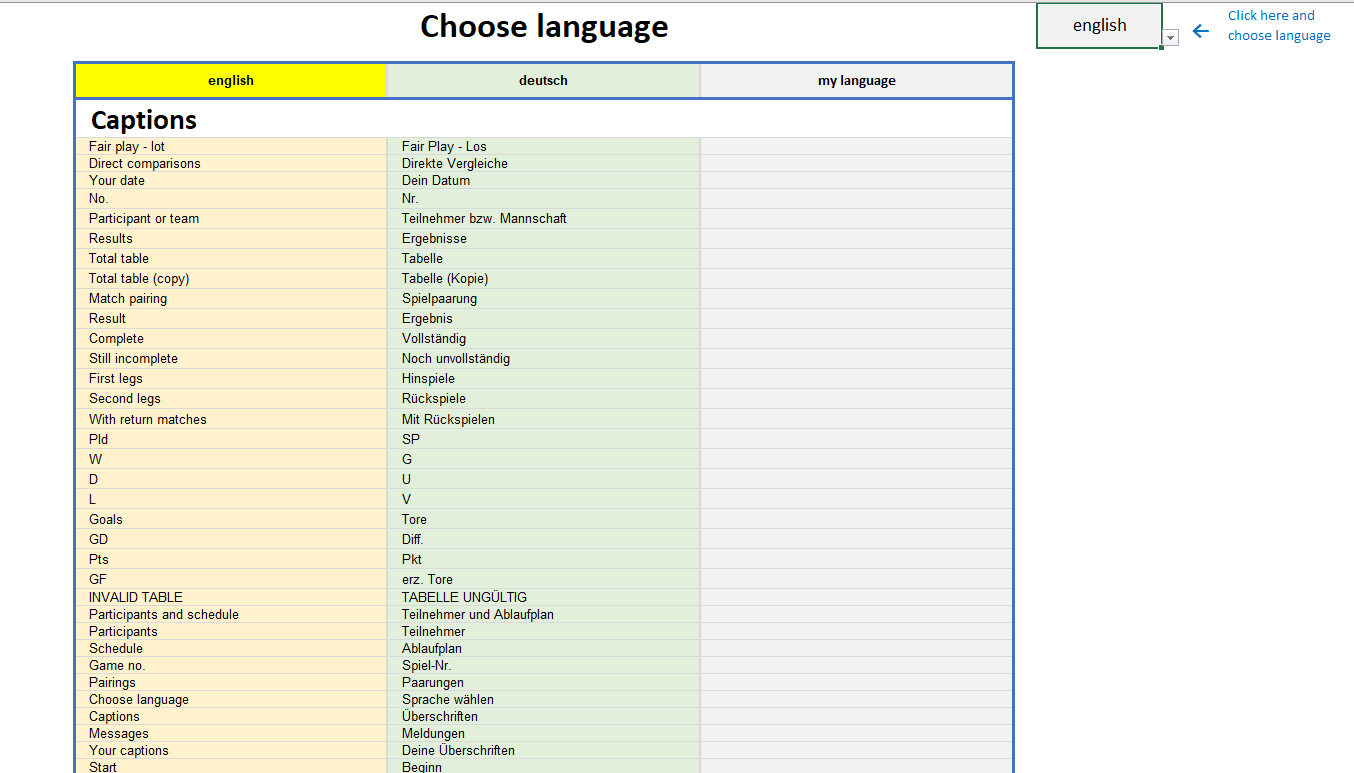
The languages German and English are available for selection. In addition, however, you can add the translations of any language, so that these tournament schedules can also be adapted to any other language.
* * *
For tournament schedule hobbyists:
If you don't use macros/VBA look at ▸Part 2.
Many would like to develop their own tournament schedule using Excel, but then fail because of the core problem of calculating the ranking order within the individual groups.
In Excel there are the cell functions SUMIF, COUNTIF, VLOOKUP etc. with which you can do beautiful things. Perhaps some tournament schedule excellers have already dreamed that Microsoft would release a GROUP_TABLE function that you type into a cell - with a few parameters, of course - and then, as if by magic, the desired group table appears - bang, it's there - nicely after that FIFA criteria sorted.
Of course Microsoft doesn't do that, the target group is far too small and therefore not lucrative enough.
No, no... this isn't an April Fool's joke.
You can download the example file here:
▸UDF_Group_table_2.2.xlsm [650 kB] (Version 2.2, last updated: 2025-09-07)
You actually enter in the edit line at the top: "=Group_table(...)", with a few parameters, and the complete group table appears - not just with all the usual columns like rank, name, pld, W, D, L, goals, diff and pts, but also optionally the tables of direct comparisons and the cross tables of all match results for first legs and second legs.
But that's not all. With the first parameter (0, 1, 2, 3 or 4) you can choose whether the FIFA regulation (goal difference and goals scored before direct comparison) or the UEFA regulation (direct comparison before goal difference and goals scored) or even (attention basketball players!) the regulations of German Basketball Association (▸§42 of the ▸DBB regulations) is applied. The DBB regulations for basketball 3x3 tournaments are also available.
[Does anyone know a link to the FIBA regulations?]
The idea of programming such a function arose when a head of basketball department at a Baden-Württemberg club asked me for help in implementing the DBB regulations for basketball tournaments using Excel.
The second parameter (usually 2 or 3) allows you to choose the number of points for a win. This depends on the sport, for example 3 points for soccer, 2 points for handball and basketball.
As is usual with an Excel function, every time a game result changes, the table is updated immediately (in a fraction of a second).
Since version 2.0 (May 10, 2025), the limit of 20 teams has been lifted. The upper limit is now 1024(!) if the tournament includes second legs, or 1448 if the tournament does not. This limitation arises because an Excel spreadsheet provides 1048576 (1 million) rows. With 1449 teams, the number of matches (excluding return matches) would exceed this limit.
= Group_table ( mode; pts_per_win; teams_1; teams_2; goals_1; goals_2; team_names [;tie_breaks] [;penalty_points] )
| Parameters | Explanation |
|---|---|
| mode | Decides which regulations will be applied 0: FIFA regulations 1: UEFA regulations 2: DBB regulations 3: DBB regulations 3x3-Tournament 4: DBB regulations 3x3-Tournament across groups |
| pts_per_win | Number of points for a win, e.g. 3 for soccer 2 for handball and basketball |
| teams_1 | Range with the team names of the home teams (must be single column) |
| teams_2 | Range with the team names of the away teams (must be single column) |
| goals_1 | Range with the goals scored by the home teams (must be single column) |
| goals_2 | Range with the goals scored by the away teams (must be single column) |
| team_names | Range with the list of all team names in the relevant group (must be single column) |
| tie_breaks (optional) |
Range with the tie-break points (If there is a draw after a tie, a plus point can be entered here for the favored team) |
| penalty_points (optional) |
Range with the penalty points (Penalty points are entered as a negative number; they will be offset against the number of points achieved) |
Example:
=Group_table(0,3,$J$6:$J$41,$L$6:$L$41,$M$6:$M$41,$O$6:$O$41,$C$6:$C$9)
The optional parameters 'tie_breaks' and 'penalty_points' are missing here.
Since it is an array formula, in older Excel versions (up to Excel 2019 inclusive) you must select the range in which the group table should appear before entering the formula, then enter the formula in the editing line and complete with CTRL-SHIFT-ENTER. The formula then appears in curly brackets in the editing line to indicate that it is an array formula. However, the curly brackets must not be entered. They are set automatically by Excel.
You can get an introduction to the topic of 'array formulas' here:
▸Introduction to the topic of 'array formulas'
And this is what the whole thing can look like:

The final table, the direct comparisons, and the cross tables for home and away matches are generated using a single (array) formula =Group_table(...). You can also display only the final table by simply preselecting a correspondingly smaller range before entering the formula in the edit line.
The sample file contains three examples: the 1x40 match schedule shown above, a 1x200 match schedule, and a 3x4 match schedule.
The second schedule, with 200 teams, lists only the first 2000 of the 19900 matches (excluding second legs) to avoid unnecessarily bloating the Excel file. It's included more for demonstration purposes. Playing with that many teams or participants will certainly only involve a small portion of the possible matches. But a tournament based on the Swiss system might be better suited for that.
▸https://hermann-baum.de/excel/Turnier/en/swiss_system.php
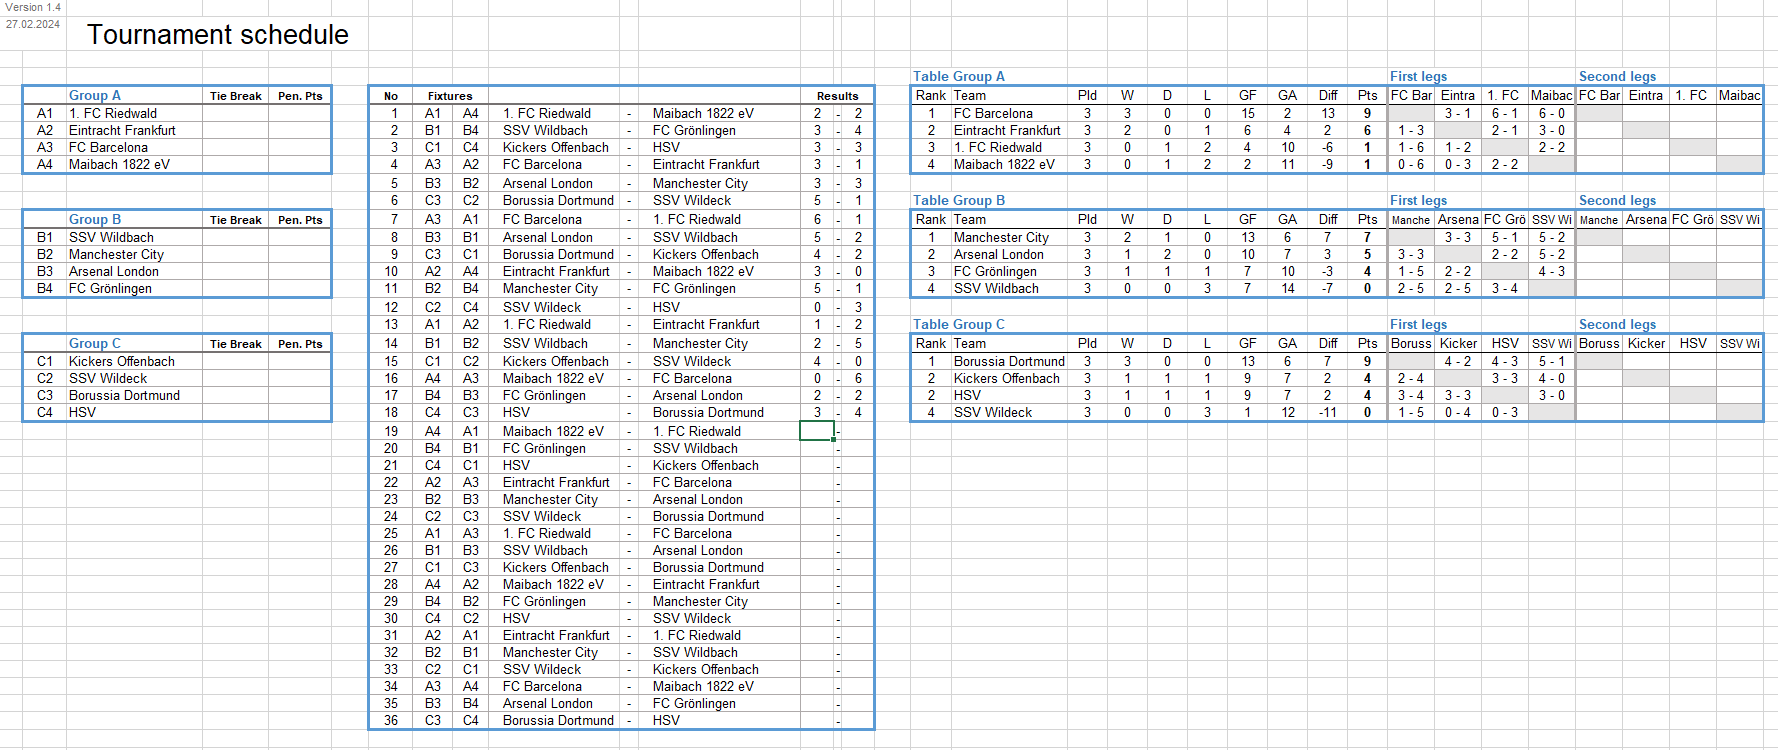
The 3x4 match schedule looks like this:

The formula for group A can be seen in the edit line above. The following formulas were entered for groups B and C:
=Group_table(0,3,$J$6:$J$41,$L$6:$L$41,$M$6:$M$41,$O$6:$O$41,$C$13:$C$16,$D$13:$D$16,$E$13:$E$16)
und
=Group_table(0,3,$J$6:$J$41,$L$6:$L$41,$M$6:$M$41,$O$6:$O$41,$C$20:$C$23,$D$20:$D$23,$E$20:$E$23)
If two teams cannot be distinguished because they are tied in points, goal difference, goals scored and direct comparison, their ranking number in the table is the same. Therefore, you have the option of using conditional formatting to make those lines whose neighboring lines have the same rank number appear in red.
If you only want to display the actual group table without the tables of direct comparisons and the cross tables for home and away games, you only select an area with 11 columns and as many rows as there are teams. Then only the first 11 columns of the results table appear (rank, name, pld, W, D, L, GF, hyphen, GA, diff, pts).
These first 11 columns are followed by an empty column as a spacer and another column with the names of the teams. Then there are 5 columns for the table with direct comparisons.
After this fixed number of 18 columns, the two cross tabs for the first and second legs follow. Each of these two crosstabs has as many columns as there are teams. In the case of 6 teams, for example, there would be a total of 18 + 12 = 30 columns. If you want to display the full group table, select a range with 30 columns and 4 rows.
If you do not want to display the 5 columns of direct comparisons, you can hide these columns, for example. But there is an even better method:
You have maximum flexibility if you create the entire table with, for example, 30 columns far to the right in an invisible area using the formula "=Group_table(...)" and then copy the columns that you want to display in the visible area from there. In this way, any selection and order of the desired columns is possible.

In the example file, the Group A table is displayed in full length. A range with 26 columns and 4 rows was preselected.
For the table for group B, an area with 18 columns and 4 rows was preselected; for the table for group C, an area with 11 columns and 4 rows was preselected.
If you want to expand a group table, for example to display the first direct comparison for group C as well as for group B, select the existing group table plus 8 additional columns to the right of it. Then click in the editing line at the top and immediately close the editing mode with the key combination CTRL-SHIFT-ENTER.
If you want to display less, for example only the first 11 columns in group A, follow the following steps:
The 3x4 schedule includes an example of a small final round. It consists of a table to determine the two best third-placed teams, a quarter-final, semi-final, match for third place, final and a final table of the best four teams.

In order to integrate the GROUP_TABLE function into an existing Excel file, it is sufficient to copy the module with the name 'UDF_Group_table' into your own project in the macro/VBA area. To do this, open the example file and your own Excel file at the same time, switch to the macro/VBA area with ALT-F11 (see following figure) and drag the name 'UDF_Group_Table' with the left mouse button onto your own project name in bold.

With version 2.0, the VBA code contains another useful function in addition to the GROUP_TABLE function:
the MATCH_PAIRINGS function.
It can be used to automatically generate match pairings for any number of teams. The match pairings for the 40 teams and also for the 200 teams in the example file were generated using this function.
You select two sufficiently long adjacent columns, enter something like "=Match_pairings(32,TRUE,TRUE)" in the edit line above, and receive the 992 match pairings for 32 teams. The second parameter, "TRUE", indicates that second legs should be played. The third parameter, "TRUE", indicates that the match pairings should not follow the standard order according to the circle method, but are generated in a random order.
= Match_pairings ( number [;second legs] [;random] )
| Parameters | Explanation |
|---|---|
| number | Number of teams or participants (must be greater than 1) |
| second legs (optional) |
TRUE or FALSE (1 or 0 also works) (Default: FALSE) |
| random (optional) |
TRUE or FALSE If FALSE, the same order of match pairings will always be generated using the circle method. (Default: FALSE) |
If the "random" parameter is set to TRUE, a different order will be generated each time the formula is recalculated. It is advisable to first generate the randomly generated match pairings in a free range and then copy them as fixed values into the relevant columns to avoid accidental recalculation.
Example: =Match_pairings(8)
Generates the 28 match pairings for 8 teams without second legs (default order according to the circle method).
In Excel 2019 or earlier, don't forget to select a suitable range and complete the formula entry with CTRL-SHIFT-ENTER!
If you want or have to do without macros/VBA for any reason (e.g. because you use open source software like 'Libre Office Calc'), you won't go away empty-handed here. You can look into the following part 2 of this hobbyist's help. I don't use any macros/VBA in my tournament schedules (except for the Swiss system), so that the tournament schedules not only run on Microsoft Excel, but also with open source software.
* * *
For tournament schedule hobbyists:
Many would like to develop their own tournament schedule using Excel, but then fail because of the core problem of calculating the ranking order within the individual groups. In my tournament plans, I use a spreadsheet called 'Calc' (Calc as an abbreviation for Calculation), which carries out these calculations for a specific group. In the case of multiple groups, I create multiple copies of this spreadsheet - one for each group. Only a few formulas then need to be adjusted in these copies so that the respective copy refers to the correct group.
So that someone who doesn't understand how this 'Calc' spreadsheet works can still use it to create their own tournament schedule, I have created an improved special version of it that can be used as a 'black box', so to speak.
A 'black box', such as a coffee machine, requires a certain input (water, coffee powder, milk, pressing a button for various options) and delivers the desired product (the selected type of coffee) as an output. You don't need to know how it works inside. It is the same with the 'Calc' spreadsheet. As input you have to tell it where it can find the group names, game results, tie-break points and penalty points, and as output it then provides the group table in the correct ranking order with points, goal differences, goals scored and the other usual information. You just have to know where the input has to go in and where the output comes out - like with the coffee machine: if you put the coffee cup under the wrong nozzle, the output will go the wrong way.
If you want your tournament schedule to have four groups, create four copies of the 'Calc' spreadsheet and adapt them to the four groups. The special thing is that you don't need any special knowledge of the internals of this spreadsheet for this adjustment. There is a clear and highlighted area on this sheet where input is made and output can be received. This area is the communication interface of this group sorting machine.
This version of the S-Class leaves little to be desired. Each group can consist of 3 to 9 participants. The number of groups is variable, but there cannot be more than 288 matches in total. The number of points for a win (usually 2 or 3) is adjustable. You can choose whether direct comparison has priority over goal difference (UEFA mode) or not (FIFA mode). As an output, the machine not only throws out the group table sorted by rank with the usual information (Pld, W, D, L, Goals, Diff, Pts), but also the cross-tabs with all the game results - one crosstab for the first legs and one for the second legs. Even the tables of direct comparisons are calculated and made available in the output area.
An example file with three groups (3 x 4 teams) is intended to show the use of the 'Calc' spreadsheet and make it easier to get started. It can be downloaded here:
▸Calc_Tournament_schedule_1.6.xlsx (last updated: 20.06.2024)
Detailed and understandable instructions are available as a PDF:
▸Calc_Instructions.pdf (last updated: 18.06.2024)
If you have downloaded a version older than version 1.6 (June 18th, 2024), please download the new version again!
Two more example files created using the 'Calc' spreadsheet:
▸Schedule for 4 groups with 9 teams per group (home and away matches)
▸Schedule for 6 groups with 6 teams per group
Essentially, you insert formulas into the input area of the 'Calc' spreadsheet that refer to the list of participants in the group in question, the fixtures and the results. These formulas are very simple references, such as "=Schedule!C6". An IF function is only used for the match results to prevent a 0-0 from appearing if the match result has not yet been entered.
If necessary, you can also insert formulas with the addresses of the input fields for tie-breaks and penalty points.
In this way, the group sorting machine is fed with data.
The list of matches is so extensive because in this example we play with three groups of four (first and second legs).
Normally it is sufficient to just refer to the matches of the group in question. However, in a tournament with multiple groups, it is often more convenient to enter the list of all matches on each Calc sheet. Each Calc sheet only takes into account the matches of the relevant group members.
The output area of the 'Calc' worksheet contains the sorted group table and - if desired - also the crosstabs of all results as well as the tables of direct comparisons. To make this visible on the tournament schedule, simple formulas of the form "=Calc!B374" are sufficient too. However, it is more advantageous to copy the entire table to the desired location on the tournament schedule using a single array formula. This array formula is then, for example, for the group table "=Calc!$B$374:$K$383". More detailed information can be found in the instructions (see ▸PDF file).
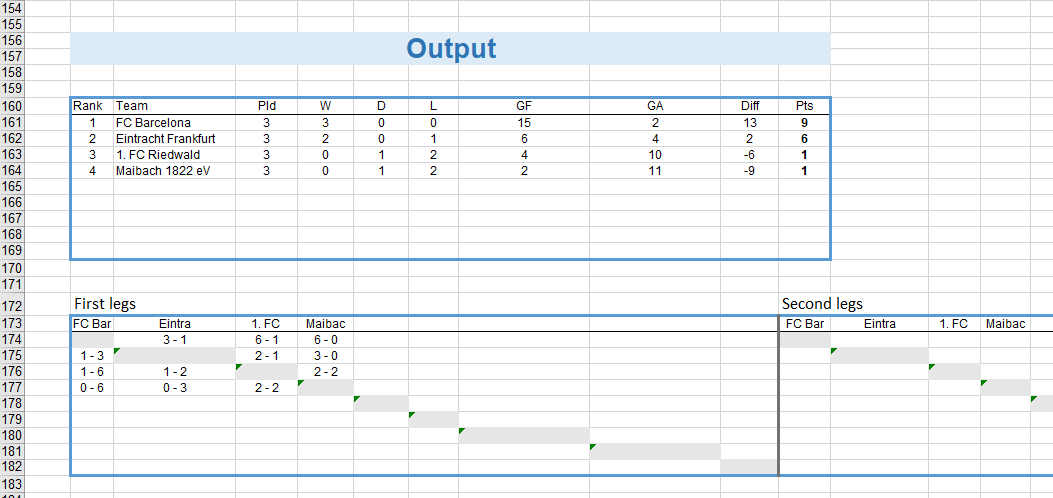
For example, a tournament schedule with three groups using the 'Calc' sheet might look like this:
You have complete freedom with the arrangement of the elements. The three tables with the participants in a group can also be positioned next to each other at the top, the game results below and the final tables below. The group tables, the game results and the final tables can also be on different worksheets. There are no restrictions there.
To integrate the Calc spreadsheet into your own Excel file, you follow two steps:
These steps are described in detail in the ▸Instructions (PDF) in section 5.
Finally, a little addition.
Often you have a list of fixtures in the form 1-2, 3-4, 1-3, 2-4, etc. available. Now I know from my own experience that it can be very annoying to create a list of fixtures in the form A1-A2, B1-B2, C1-C2, A2-A4, B2-B4, C2-C4, etc. I thought it would be nice if you could simply specify the number of groups and the number of teams per group, and . . . voilà - you have the list of fixtures.
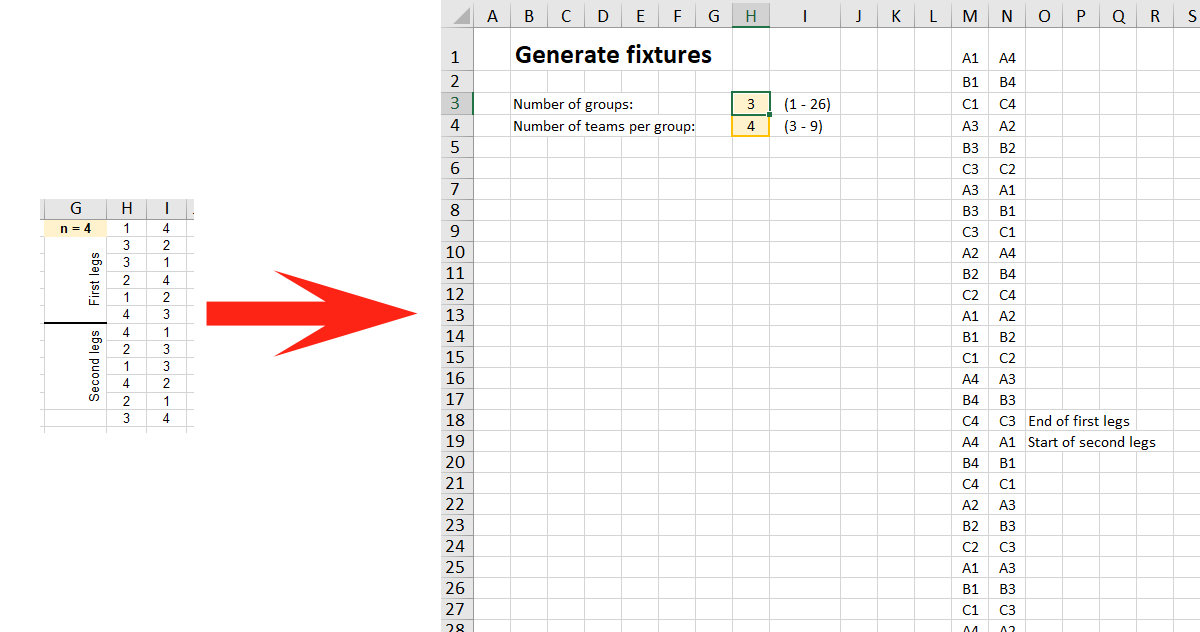
All it took was a few lines of VBA program. However, like all Excel files with VBA code, this small VBA program only runs under Microsoft Excel, not with open source spreadsheet programs.
Here is the download link:
▸Fixtures_several_groups.xlsm (last updated: 31.01.2024)
* * *